
NIR, MIR, and Raman Spectroscopy: A Comparative Guide to Choosing the Right Technique
Walk into any modern analytical laboratory — or onto any well-instrumented production floor — and you are likely to find at least one of three spectroscopic technologies at work: near-infrared (NIR), mid-infrared (MIR), or Raman spectroscopy. Each exploits the interaction of light with molecular bonds to generate a chemical fingerprint. Each has found a home in quality control, process analytical technology (PAT), research, and regulatory compliance. And yet they are far from interchangeable.
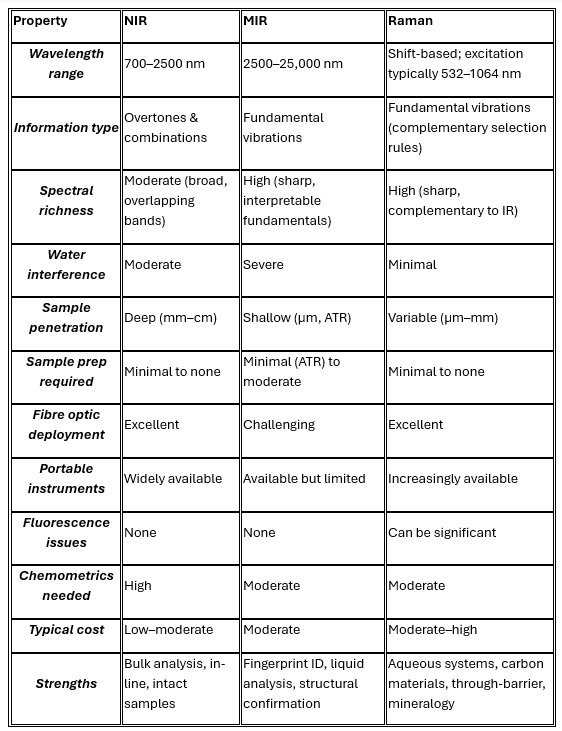
The differences between NIR, MIR, and Raman spectroscopy go deeper than instrument price or spectral range. They reflect fundamentally different physical mechanisms, different sensitivities to different classes of molecules, and very different practical constraints around sample preparation, water interference, and deployment environment. Understanding where each technique excels — and where it struggles — is essential for anyone selecting or designing an analytical platform.
This article provides a thorough comparative overview of all three techniques: their physical principles, shared capabilities, key differences, and the material types and application domains where each characteristically shines.
The Shared Foundation: Molecular Vibrations
All three techniques are rooted in the same underlying chemistry: molecular vibrational spectroscopy. Chemical bonds are not rigid — they stretch, bend, twist, and rock at frequencies determined by the masses of the bonded atoms and the stiffness of the bond. These vibrational frequencies fall in the infrared region of the electromagnetic spectrum and are exquisitely sensitive to molecular structure.
Where NIR, MIR, and Raman diverge is in how they probe those vibrations:
MIR measures direct absorption of infrared light at the fundamental vibrational frequencies of molecular bonds.
NIR measures absorption at overtone and combination frequencies — harmonics of the fundamental vibrations, occurring at shorter (higher energy) wavelengths.
Raman measures the inelastic scattering of visible or near-infrared laser light, where photons exchange energy with molecular vibrations and are scattered at shifted frequencies.
This difference in mechanism has profound consequences for spectral information content, sensitivity, selectivity, and practical applicability.
Near-Infrared Spectroscopy (NIR)
Physical Basis
NIR spectroscopy operates in the wavelength range of approximately 700–2500 nm (wavenumber range ~4000–14,000 cm⁻¹). The absorptions observed in this region arise from overtones (first, second, and third harmonics) and combination bands of fundamental molecular vibrations — predominantly those involving X–H bonds, where X is carbon, nitrogen, or oxygen.
Because overtone and combination transitions are quantum-mechanically "forbidden" to varying degrees, they are inherently weaker absorbers than the corresponding fundamental transitions in the MIR. This is simultaneously a limitation and an advantage: it means NIR light penetrates deeply into samples (centimetres rather than micrometres), making NIR uniquely suited to bulk, non-destructive measurement of intact samples.
Key Characteristics
Spectral range: 700–2500 nm
Primary bond sensitivity: O–H, N–H, C–H overtones and combinations
Sample penetration depth: millimetres to centimetres
Water interference: Significant — water absorbs strongly in NIR, but manageable with pre-processing
Fibre-optic compatibility: Excellent — standard silica fibres transmit efficiently across the NIR range
Instrument cost: Moderate; robust, portable instruments widely available
Chemometric requirement: High — NIR spectra are broad and highly overlapping; multivariate calibration (PLS, PCR, neural networks) is almost always required
Where NIR Excels
1. Intact Grain and Cereal Analysis NIR is the gold standard for grain quality assessment. Intact wheat, barley, maize, and soybeans can be scanned without grinding, and models for protein, moisture, oil, starch, and fibre content are commercially mature. The deep penetration of NIR light allows representative bulk sampling, and modern diode array instruments can scan a full spectrum in milliseconds — enabling high-throughput intake analysis at grain elevators and mill intake points.
2. Pharmaceutical Tablet and Blend Analysis NIR is used extensively in pharmaceutical manufacturing for blend uniformity monitoring, tablet content uniformity, coating thickness measurement, and polymorphic form identification. The non-destructive nature of NIR allows 100% inspection of tablet batches without sacrificing product. Transmission NIR through intact tablets provides information from the tablet core rather than just its surface.
3. Forage and Feed Quality Dried and ground forages, silages, and compound feeds are among the most established NIR application areas. Crude protein, neutral detergent fibre (NDF), acid detergent fibre (ADF), dry matter, and digestibility parameters are routinely predicted from NIR spectra with accuracies that rival or exceed conventional wet chemistry for well-maintained calibration databases.
4. Fruit and Vegetable Quality Sorting The penetrating power of NIR makes it uniquely capable of assessing internal quality in intact fruit — soluble solids content (°Brix), dry matter, firmness, and bruise detection — without cutting or sampling. Online conveyor-mounted NIR systems are now standard in apple, mango, citrus, and avocado packing operations worldwide.
5. Petrochemical Process Streams NIR is widely deployed in refinery and blending applications for octane number prediction, aromatic content, and distillation properties of fuels. Its robustness, fibre-optic compatibility, and tolerance of high-pressure sampling interfaces make it well-suited to inline process streams.
Mid-Infrared Spectroscopy (MIR)
Physical Basis
MIR spectroscopy covers the 2500–25,000 nm wavelength range (approximately 400–4000 cm⁻¹), which encompasses the fundamental vibrational frequencies of virtually all organic and many inorganic functional groups. Absorptions in this region are stronger by orders of magnitude than their NIR counterparts, because fundamental transitions are fully quantum-mechanically allowed.
The MIR spectrum is rightly called the "molecular fingerprint region." Below approximately 1500 cm⁻¹ — the fingerprint region proper — complex patterns of overlapping fundamentals produce a spectral signature as unique to a molecule as a human fingerprint. Above 1500 cm⁻¹, characteristic group frequencies (carbonyl C=O stretches near 1700 cm⁻¹, N–H stretches near 3300 cm⁻¹, and so on) provide immediate, interpretable structural information.
Modern MIR instruments almost universally use Fourier Transform Infrared (FTIR) detection, which offers high spectral resolution, excellent signal-to-noise, and rapid acquisition. Attenuated Total Reflectance (ATR) sampling accessories have transformed MIR from a technique requiring elaborate sample preparation into one capable of direct, contact measurement of liquids, pastes, and soft solids with minimal preparation.
Key Characteristics
Spectral range: 2500–25,000 nm (400–4000 cm⁻¹)
Primary bond sensitivity: All fundamental vibrational modes; C=O, C–O, N–H, O–H, C–H, and inorganic bonds
Sample penetration depth: Micrometres (ATR); highly variable in transmission
Water interference: Severe — water is an extremely strong MIR absorber, often dominating spectra of aqueous samples
Fibre-optic compatibility: Limited — standard silica fibres do not transmit MIR; chalcogenide or silver halide fibres required
Instrument cost: Moderate to high; ATR-FTIR benchtop instruments widely available; inline deployment more challenging
Chemometric requirement: Moderate — spectra are more interpretable than NIR, but quantitative work still requires calibration
Where MIR Excels
1. Edible Oils and Fats Characterisation MIR-ATR is the dominant technique for rapid analysis of edible oils, with established methods for fatty acid profile, iodine value, free fatty acid content, and adulteration detection. The carbonyl stretch of ester bonds near 1745 cm⁻¹ and the C=C stretch of unsaturated fatty acids near 3010 cm⁻¹ provide direct, interpretable markers. Dedicated dairy and oil analysers based on FTIR have become standard in quality laboratories across the food industry.
2. Milk and Dairy Fluid Analysis The international standard for milk compositional analysis (fat, protein, lactose, urea) relies on FTIR spectroscopy. Instruments such as the FOSS MilkoScan exploit MIR absorption at defined wavelengths corresponding to protein amide bonds, ester bonds in milk fat, and carbohydrate absorptions in lactose. Thousands of dairy payment systems globally are anchored to FTIR-based milk analysis.
3. Polymer Identification and Quality Control The MIR fingerprint region is unmatched for unambiguous polymer identification. Polyethylene, polypropylene, PET, nylon, and hundreds of other polymers each produce a unique fingerprint spectrum. MIR is used for incoming material verification, recyclate identification and sorting, contamination detection, and degree-of-crystallinity measurement in polymer manufacturing.
4. Pharmaceutical Raw Material Identification Regulatory expectations (USP, EP, ICH Q6A) for identity testing of pharmaceutical raw materials are frequently met using FTIR. The technique provides unambiguous identity confirmation — or rejection — of active pharmaceutical ingredients and excipients based on their fingerprint spectra, with comparison against reference spectral libraries. This is one of the most rigorously validated applications of MIR in any industry.
5. Environmental and Soil Analysis Diffuse reflectance FTIR (DRIFT) of soil samples enables simultaneous prediction of organic carbon, clay mineralogy, cation exchange capacity, and nutrient levels. MIR soil calibrations, particularly those built on large national databases, have proven highly accurate and are increasingly used in digital soil mapping projects as a cost-effective alternative to conventional laboratory analysis.
Raman Spectroscopy
Physical Basis
Raman spectroscopy occupies a different conceptual space from NIR and MIR. Rather than measuring the absorption of infrared photons, it measures the inelastic scattering of monochromatic visible or near-infrared laser light. When a photon strikes a molecule, the vast majority are scattered elastically (Rayleigh scattering) with no change in energy. A tiny fraction — roughly one in ten million photons — exchange a quantum of energy with a molecular vibration and are scattered at a shifted frequency. This frequency shift, measured in wavenumbers, corresponds directly to the energy of the molecular vibration involved.
Crucially, the selection rules governing which vibrations are Raman-active are different from those governing infrared activity. A vibration is IR-active if it involves a change in dipole moment; it is Raman-active if it involves a change in polarisability. For symmetric molecules, these two sets are mutually exclusive (the rule of mutual exclusion). In practice, this means Raman and IR spectra are highly complementary: vibrations that are weak or invisible in IR are often strong in Raman, and vice versa.
One consequence of profound practical importance: Raman spectroscopy is largely insensitive to water. Water has an extremely small change in polarisability during its vibrational modes, making it a weak Raman scatterer. This single property opens up entire classes of aqueous and biological samples that are effectively inaccessible to MIR and challenging for NIR.
Modern Raman instruments most commonly use 785 nm or 1064 nm near-infrared excitation lasers to minimise fluorescence interference, with dispersive spectrographs and CCD detectors. Spatially Offset Raman Spectroscopy (SORS) and Transmission Raman extend the technique's reach into subsurface and through-container measurement.
Key Characteristics
Spectral range: Same fundamental vibrational information as MIR (presented as Raman shift, 0–4000 cm⁻¹)
Primary bond sensitivity: Symmetric vibrations; C=C, S–S, C–S, ring breathing modes; excellent for inorganic species
Sample penetration depth: Variable; surface-sensitive with standard backscatter; millimetres with SORS/transmission
Water interference: Minimal — water is an extremely weak Raman scatterer
Fibre-optic compatibility: Excellent — standard silica fibres transmit the visible/NIR laser and scattered light efficiently
Instrument cost: Moderate to high; handheld and portable instruments increasingly available
Fluorescence interference: A significant challenge for many organic and biological samples; mitigated by NIR excitation or shifted-excitation methods
Where Raman Excels
1. Aqueous Pharmaceutical and Biological Solutions Raman's insensitivity to water makes it the technique of choice for analysing active pharmaceutical ingredients in aqueous solution, monitoring biopharmaceutical fermentation broths, and characterising protein secondary structure in buffered solutions. Applications include real-time monitoring of glucose and lactate in cell culture media, and identity confirmation of biologic drug substances without the drying steps that MIR would require.
2. Gemstone and Mineral Identification Raman spectroscopy is the definitive technique for non-destructive identification of gemstones, minerals, and pigments. The strong, sharp Raman bands of crystalline materials — particularly symmetric stretching modes of silicates, carbonates, sulphates, and oxides — provide unambiguous identification with no sample preparation. Museum conservation labs, gemological institutes, and mining companies rely on Raman for provenance, authentication, and mineralogical mapping.
3. Through-Packaging and Through-Container Analysis Transmission Raman and SORS allow measurement of materials through opaque or translucent packaging — blister packs, plastic containers, bottles, and security envelopes — without opening or destroying the package. This capability has made Raman the technique of choice for pharmaceutical counterfeiting detection, airport security screening, and non-destructive content verification of sealed containers.
4. Carbon Materials and Battery Research Raman is uniquely sensitive to carbon-carbon bonding configurations. The D and G bands of graphitic carbon, and the 2D band of graphene, are Raman-active but IR-inactive — making Raman essentially the only vibrational spectroscopic tool for characterising graphene, carbon nanotubes, graphite, diamond, and amorphous carbon. Battery electrode materials, carbon fibre composites, and semiconductor thin films are all characterised predominantly by Raman.
5. Counterfeit Detection and Forensic Analysis The combination of molecular specificity, minimal sample preparation, non-destructiveness, and excellent performance on coloured, aqueous, or packaged samples makes Raman a powerful forensic tool. Applications include illicit drug identification (including fentanyl analogues), explosive detection, ink and dye analysis in questioned documents, and authentication of luxury goods.
Complementarity: Using Multiple Techniques Together
One of the most important insights in applied spectroscopy is that NIR, MIR, and Raman are not rivals but complements. Because MIR and Raman have mutually exclusive or complementary selection rules, and because NIR provides unique sensitivity to bulk physical properties and X–H chemistry, combining two or more techniques often yields information that none could provide alone.
In pharmaceutical process analytical technology, for example, Raman monitoring of a crystallisation process can track polymorphic form in situ in the aqueous mother liquor (where MIR would be swamped by water), while NIR monitoring of the isolated and dried solid tracks moisture content and blend uniformity. Together they provide a more complete picture of both the process and the product than either could alone.
In food analysis, MIR provides gold-standard liquid compositional data (milk fat, protein, fatty acid profile), NIR provides intact and dried solid analysis (grain, feed, flour), and Raman provides identity confirmation and adulteration detection in situations where fluorescence and sample colour can be managed. A well-designed analytical platform may draw on all three.
Practical Decision Framework
When selecting between NIR, MIR, and Raman for a new application, the following questions provide a practical starting framework:
Is the sample primarily aqueous? If yes, Raman is strongly preferred. MIR is feasible with careful subtraction or attenuated path lengths. NIR is workable but requires substantial pre-processing.
Is sample throughput and speed critical, with minimal preparation acceptable? NIR is typically the leader here, particularly for intact solid samples in an inline or at-line setting.
Is unambiguous molecular identity confirmation the primary goal? MIR (fingerprint matching) or Raman (sharp, specific bands) are preferred over NIR, which requires a calibration model and cannot easily provide library-matchable identity confirmation.
Does the sample contain carbon materials, minerals, or symmetric inorganic species? Raman is likely the only viable vibrational technique; these species are typically MIR-inactive or NIR-inactive.
Is the sample coloured or highly fluorescent? NIR or MIR will be preferred; fluorescence is not a concern in either. Raman fluorescence interference may be severe, although NIR-excited Raman systems (1064 nm) significantly mitigate this.
Is deployment in a harsh industrial environment required? NIR and Raman both offer robust fibre-optic probe configurations suitable for process environments. MIR inline deployment is more technically demanding and less common.
NIR, MIR, and Raman spectroscopy each occupy a distinct and valuable niche in the analytical toolkit. They share a common foundation in molecular vibrational spectroscopy and a common commitment to rapid, non-destructive chemical analysis — but they differ profoundly in the physical mechanisms they exploit, the types of molecular information they access, and the practical constraints they impose on sampling and deployment.
NIR excels where bulk, non-destructive analysis of intact or minimally prepared samples is needed, and where quantitative prediction of physical and chemical properties through multivariate calibration is the goal. MIR delivers unmatched fingerprint specificity and fundamental structural information, and remains the reference technique for liquid compositional analysis and raw material identification. Raman fills the critical gap that water opens in the IR world — enabling analysis of aqueous, biological, and aqueous-phase process samples — while also providing unique access to carbon, mineral, and symmetric inorganic chemistry that neither IR technique can match.
Knowing when to reach for each — and when to combine them — is one of the most valuable skills an analytical scientist can develop. In a world of increasingly complex materials and increasingly demanding quality and regulatory standards, that knowledge translates directly into better science and better products.